


Three years out from the 2028 presidential election, the invisible primary is well underway in both parties, and a steady stream of rankings of the likely contenders has begun appearing in the political press. One of the standard pieces of evidence in those rankings is the state-level approval rating of the politicians involved, on the implicit theory that popularity at home is a leading indicator of popularity nationally.
The early 2028 conversation has a paradox it has not yet figured out how to resolve. Gov. Andy Beshear has won statewide twice in Kentucky, a state Donald Trump carried by roughly 30 points. Beshear has higher approval numbers than any other Democratic governor in the country. Republican pundits privately concede he would be the most difficult Democrat to run against. And yet polls of Democratic primary voters give him 2% support. Newsweek asked earlier this year why Beshear was not a frontrunner. Instead, the Democratic frontrunner conversation has settled on California Gov. Gavin Newsom. The Republican frontrunner is more clear, with JD Vance leading a pack of other candidates who are being judged on the same kind of state-level approval evidence that has elevated Newsom on the Democratic side.
How to gain a clearer picture of the 2028 race
The 2028 conversation is being shaped, on both sides, by approval numbers that are not strictly comparable across states. A politician’s raw approval rating reflects both the politician and the partisan composition of the electorate that’s giving the rating. To know which of the popular state officials has a genuine case to make to a national electorate, we need to account for the partisan composition.
That is what I did using approval ratings from the November 2025 Cooperative Election Study, which interviewed roughly 17,000 Americans. Adjusting each state’s sample to match the national partisan distribution produces a different leaderboard. Most politicians on both sides look weaker. A few popular politicians on both sides maintain, or even increase their popularity when I adjust for the national partisan balance.
One Democrat stands out under the adjusted approval ratings
This analysis reveals seven Democratic office holders who received approval ratings at or above 60% in 2025. Of those, four see their approval ratings drop into the mid-50% range when I adjust the partisan balance of their state populations to match the national distribution. For example, Maryland Sen. Chris Van Hollen’s 68% approval rating would drop to 55% if Maryland looked more like the United States.
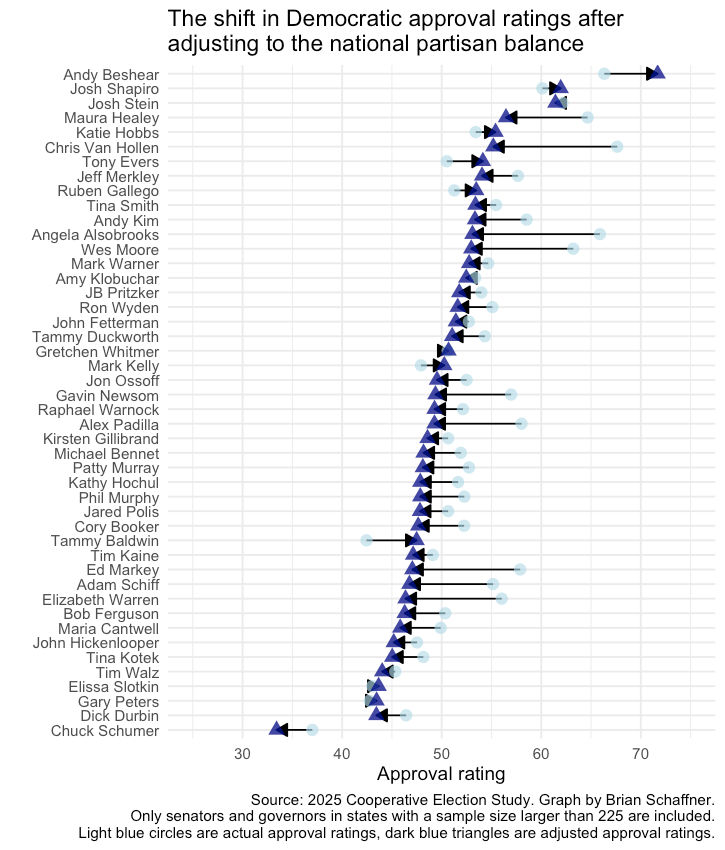
Two of the seven, Pennsylvania Gov. Josh Shapiro and North Carolina Gov. Josh Stein, have very similar approval ratings after adjustment. This makes sense since they represent states whose partisan distributions are pretty close to the national party balance.
But there is one popular Democratic politician whose approval rating shifts even higher after the adjustment, and that is Andy Beshear. His 66% approval rating in Kentucky translates into an adjusted approval rating of 72%. He is the rare popular statewide politician who would be even more popular if his state looked more like the nation as a whole. While several Democrats can boast an approval rating similar to Beshear’s, nobody is within 10 percentage points of his adjusted approval rating.
Nearly every Republican loses ground in the adjusted approval ratings
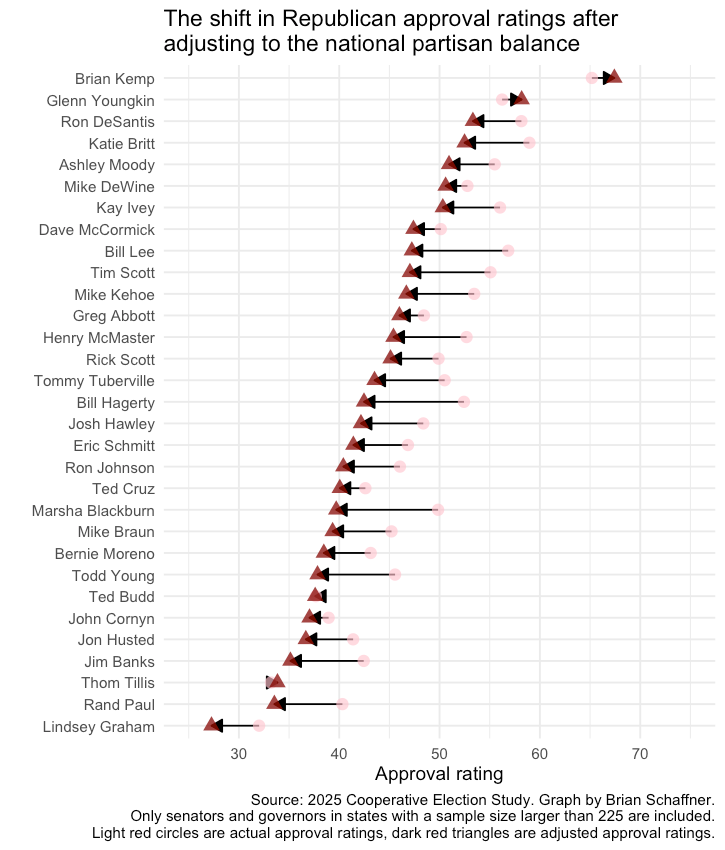
The next graph shows the actual and adjusted approval ratings for Republican politicians. The pattern here is fairly uniform: 28 of the 31 Republican politicians in the graph see their approval ratings drop when adjusted to match the national partisan distribution. Fourteen of these Republican politicians have an approval rating over 50% – but half of those would see that rating drop below 50% under the adjusted ratings.
There are two Republicans with strong approval ratings that become slightly stronger under the adjustment – Georgia Gov. Brian Kemp and former Virginia Gov. Glenn Youngkin. The shift here is small, but the fact that their actual approval ratings stand up to the adjustment shows that these Republicans have garnered success in states that look a lot like the nation when it comes to partisanship. Kemp is the standout here, with an adjusted approval rating that reaches 66%.
Not all popular statewide politicians are created equal
The 2028 conversation is being shaped by signals that systematically advantage some candidates and disadvantage others. The approval ratings being held up as evidence of Newsom’s strength in California, or Gov. Wes Moore’s in Maryland, are partly numbers about the politicians and partly numbers about the states. Once we hold the states constant, the politicians look different from one another than the rankings suggest. The same is true for many of the Republicans in the next tier behind Vice President JD Vance.
Of course, no single metric will determine who can win a national election. But to the extent that party activists want to use approval ratings to identify popular politicians – and the coverage so far suggests they do – both sides are looking at a leaderboard that is often picking up something other than what they think it is measuring. The Democrat with the strongest case to make to a national electorate is currently outside the top tier, and the Republican whose approval is most resilient to a tougher partisan mix is being treated as a long shot. Whether either party updates its frontrunner conversation to align with what its own state-level data are showing will say something about how seriously each party is taking the question of broad-based national appeal.

.jpg)