It’s not news that people tend to have an unfavorable view of the opposite party. But it’s a tendency worth monitoring – and the newly released 2024 American National Election Study (ANES) provides an update on this trend.
The ANES asks respondents to rate the “the Democratic Party” and “the Republican Party” on a 0-100 scale called a “feeling thermometer.” Here’s how that’s described to respondents:
We’d also like to get your feelings about some groups in American society. When I read the name of a group, we’d like you to rate it with what we call a feeling thermometer. Ratings between 50 degrees-100 degrees mean that you feel favorably and warm toward the group; ratings between 0 and 50 degrees mean that you don’t feel favorably toward the group and that you don’t care too much for that group. If you don’t feel particularly warm or cold toward a group you would rate them at 50 degrees. If we come to a group you don’t know much about, just tell me and we’ll move on to the next one.
The graph below focuses on people who identify with or lean toward either the Democratic or Republican party. (This is the vast majority of Americans, since most independents say that they lean toward one party.) The graph shows people’s average ratings of their own party and the opposite party.
Note that the ANES initially asked people’s feelings about “Democrats” and “Republicans” (1964-1982) – i.e., about partisans – and then shifted to asking about “the Democratic Party” and “the Republican Party.” It’s also important to separate people based on how they took the survey: either talking to a live interviewer or completing the survey themselves (on the web or on paper).
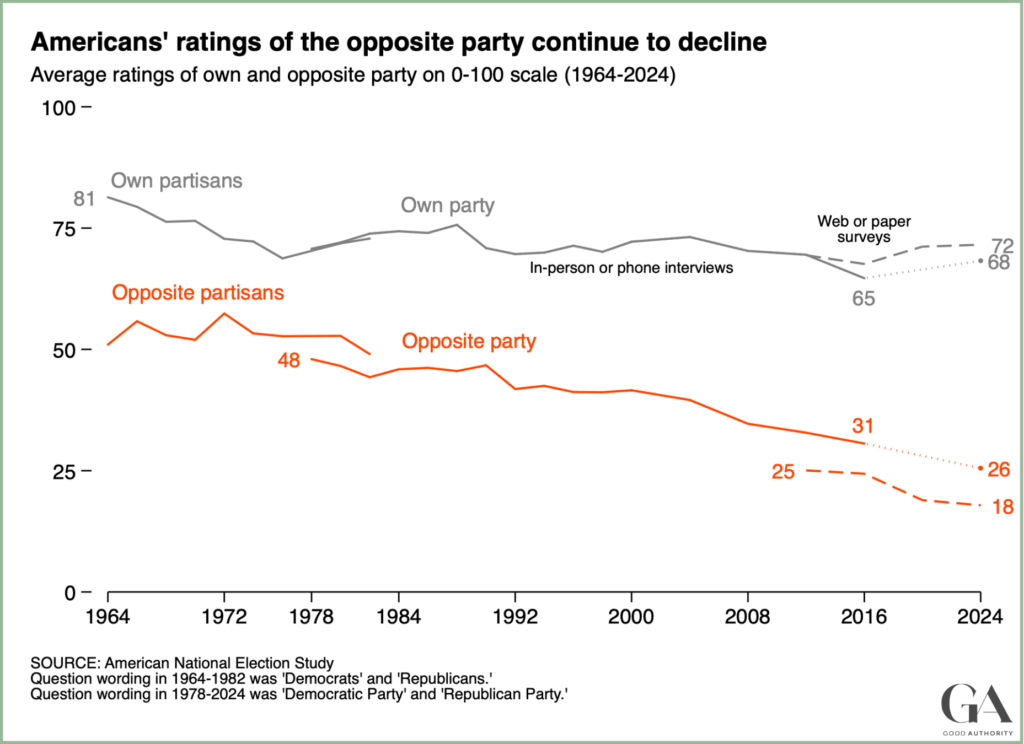
People’s views of their own party are positive, on average. After a small decline between 1964 and 1976, those ratings have been pretty stable.
But people’s views of the opposite party have become less favorable. In the in-person or phone interviews (solid lines), the average rating of the opposite party was 48 in 1978 – or very close to the “don’t feel particularly warm or cold” rating of 50. In 2016, that had dropped to 31. In 2020, there weren’t in-person interviews because of covid-19, but in 2024, when those interviews resumed, the average was 26. (The graph combines Democrats and Republicans, who are equally unfavorable to the opposite party.)
The self-completed surveys (dashed lines) show that views of the opposite party are even less favorable – roughly 6-8 points lower than in the in-person interviews. This reflects the well-known tendency of survey respondents to conceal or soften negative views when talking to an interviewer. The irony is that the ANES may have been underestimating negative feelings toward the opposite party by relying on in-person interviews for most of its history!
In interpreting this graph, it’s important to keep in mind a couple of things.
First, we shouldn’t impute emotional content to these survey questions. The questions asks about favorability and cool or warm feelings. But you will see people talk about this trend as if it suggests “hostility” or even “hatred.” Maybe there’s evidence of such feelings in other survey questions. But feeling thermometers alone don’t register those emotions.
Second, we shouldn’t assume that respondents are thinking about the ordinary Democrats or Republicans they might meet on the street. In fact, some research suggests that when asked about “the Democratic party” or “the Republican party,” people are thinking mainly about party leaders and activists. That may explain why evaluations of the opposite party are lower than evaluations of opposite partisans.
There’s obviously more to say about this trend, which is often referred to as “affective polarization.” This is a nice review piece on its causes and consequences.
A final question is how we should feel about affective polarization. It’s customary to bemoan these cooler feelings for the opposite party. There are huge projects devoted to trying to make people less polarized. That seems like a worthy enough goal.
However, in a sense, cooler feelings are understandable and rational. For many years, the parties have offered increasingly different ideas and visions for the country. And citizens very much notice this distance.
In that world, shouldn’t we expect people to view the other side less favorably? Wouldn’t it be a little odd if they didn’t?
Stay up to date on all things politics and political science. Bookmark our landing page and sign up for Good Authority’s weekly newsletter by entering your email address in the box below.