


There have, it seems, been better days to be Vladimir Putin.
According to a new survey from WCIOM, one of Russia’s leading polling agencies, trust in the Russian president has fallen to an all-time low of 31.7 percent. As the economy struggles and real disposable incomes look set to decline for the sixth straight year, the bloom is very much off the Crimean rose. After some consternation from the Kremlin, the same agency released a new survey using a different method and yielding a number almost twice as high.
Even Putin’s job approval figures — while still at a healthy 65.8 percent — are 20 points off their highs. The real bad news for Putin, however, is what the polls aren’t showing: Russians are clamming up.
How much do Russians trust Putin — and approve of his job performance?
The basic story of Putin’s popularity is familiar enough. The red top line in the figure below, taken from WCIOM polls from 2006 through to a couple of weeks ago, shows the percentage of people saying they approve of the job the Russian president is doing in office. It shows a big dip in 2008, when Putin hands the presidency over to Dmitry Medvedev, followed by a gradual decline and a slight recovery once Putin comes back to the Kremlin in 2012, and then a massive and prolonged bump after the annexation of Crimea. This question is the closest to the hypothetical election one — “if an election were held next Sunday, would you vote for X” — and it’s usually taken as the most important.
The blue middle line on the chart, though, is the one that’s in the news: the percentage of people who tell WCIOM that they trust Putin. It mirrors the approval line, but it doesn’t suffer from the Medvedev plunge in 2008 because the question is about Putin himself, rather than the chair he sits in. And the line at the bottom is the gap between approval and trust. When Putin’s in office, it tends to range between 20 and 30 percentage points; the gap narrows when Medvedev is president, because Medvedev’s approval ratings are lower than Putin’s.
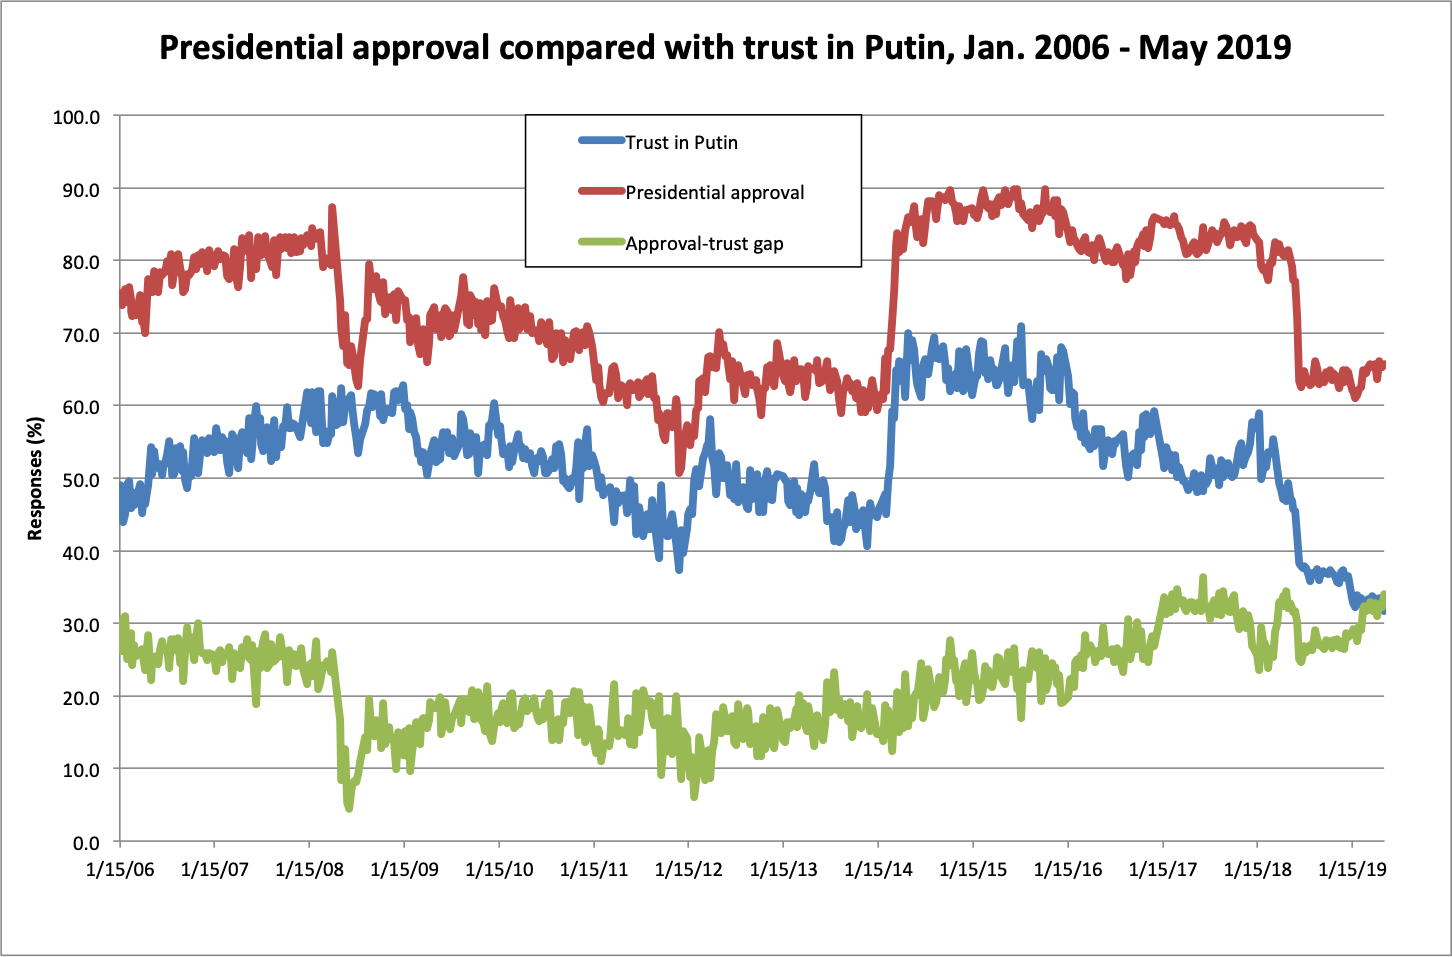
Data: WCIOM
Figure: Samuel A. Greene
Trust is lower than approval because trust is an emotional response to experience. I can approve of the way the plumber fixed my sink, but does that really mean I trust him? As with plumbers, so it is with presidents: Some proportion of people in society will be more or less satisfied with the job done running the country, but only a portion of those satisfied people will have a positive emotional response to that job performance. It is perhaps unsurprising that a prolonged economic downturn has dampened people’s emotions and thus their trust.
But the situation is a lot more complicated than that. In the figure below, the top line is trust in Putin, as in the previous chart. But the line at the bottom is the number of people in each round of the WCIOM surveys who say that they do not trust Putin. Oddly, even as trust in Putin plummets, the number of people telling WCIOM that they don’t trust him remains virtually flat.
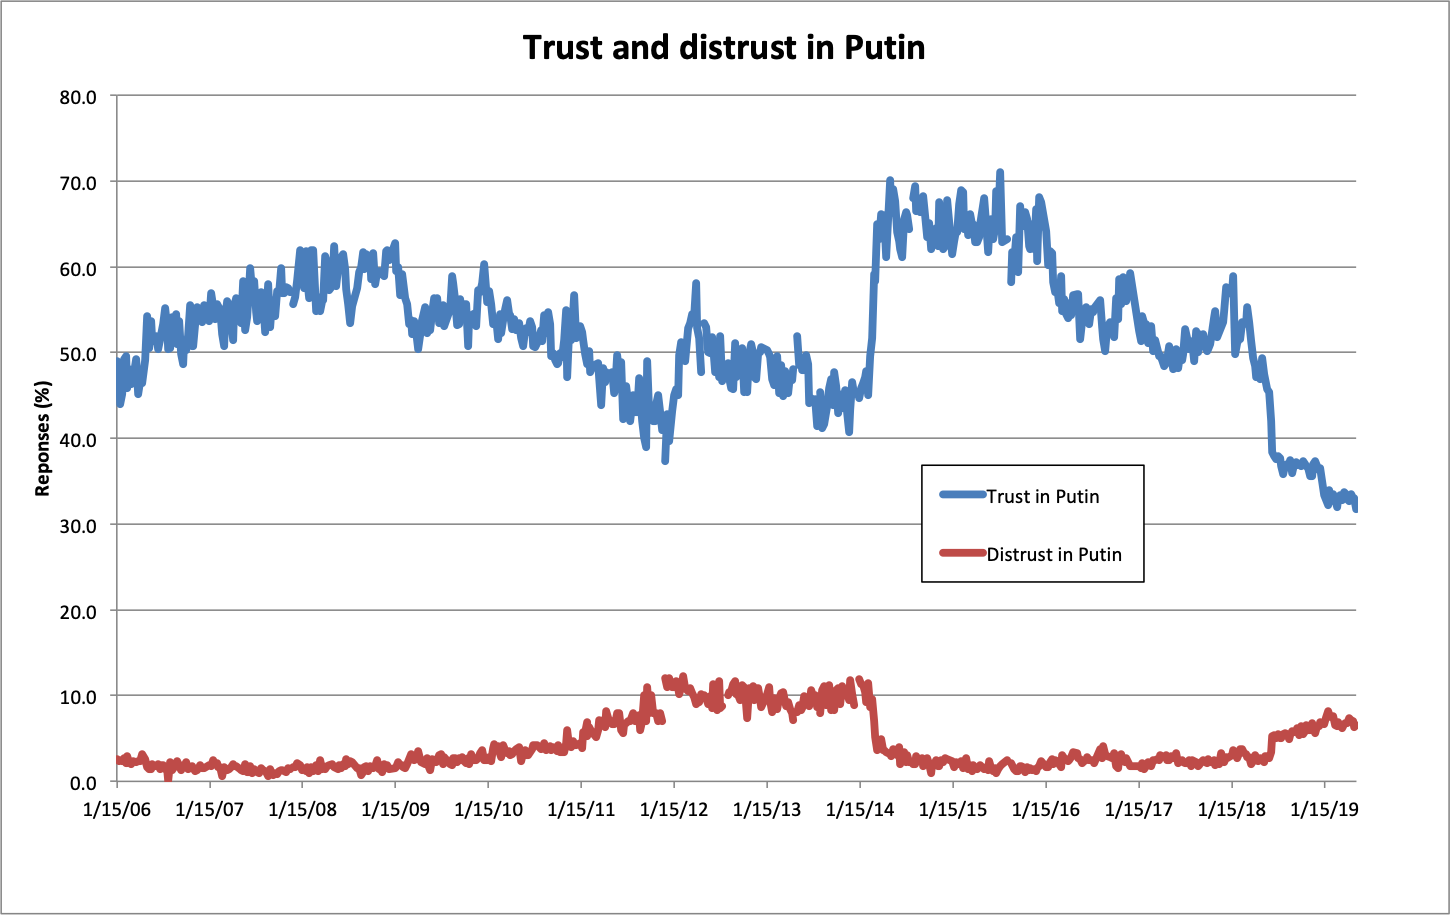
Data: WCIOM
Figure: Samuel A. Greene
More people are avoiding the question. And that’s telling.
It’s the gap between those two lines that begins to tell the real story of current Russian politics. When pollsters ask people questions about trust or approval, respondents have a third option: decline to answer the question. The number of people who choose that option — who clam up when asked whether they trust Putin — declined dramatically after Crimea, but it has grown rapidly in recent months. But the number of people refusing to answer the “approval” question has gone in the opposite direction. And therein lies the rub for Putin.
The top line in the figure below is the number of people who refuse to answer the question on trust, ranging from 30 to 60 percent; the bottom line is the number who refuse to answer the question on approval, ranging from 5 to 20 percent. Clearly, for most of the period from 2006-2019 (except for a confusing span of time when Medvedev becomes president and people don’t yet know what to make of him), people are much more inclined to answer the less emotional question about approval than they are to answer the more personal question about trust, regardless of what their actual levels of approval and trust might be.

Data: WCIOM
Figure: Samuel A. Greene
What this last figure really shows, though, is four distinct periods. In two of them — periods of what we might call consonance — the non-answer trends move together. In the second half of Putin’s second term, from 2006 to 2008, non-answering goes down on both questions, as both approval and trust ride relatively high. And from the annexation of Crimea in 2014 through Putin’s reelection in 2018, non-answering starts low but gradually creeps back up on both questions, as the faltering economy erodes people’s enthusiasm, even if social pressure to give the “right” answers remains high. For most of this period, Putin’s approval and trust numbers are at record highs. (The light blue lines in the chart roughly mark the beginning and end of these periods.)
But there are also two periods of what we might call dissonance: when the non-answer lines for trust and approval move in opposite directions. The first of these begins with Medvedev’s presidency and lasts right up until Crimea: As approval falls, so does the number of people refusing to answer, but as trust falls, the number of people not answering the question grows. (It dips when Putin returns to the Kremlin in 2012, but it goes right back up again.) This period saw Putin’s greatest political challenge to date, the Bolotnaya protests of 2011-2012. Even if things were outwardly okay, there were unpleasant emotions below the surface.
The second period of dissonance — which we’re in — began with Putin’s reelection in 2018. Once again, the number of people avoiding the approval question falls, while the number of people avoiding the trust question has soared. In fact, the gap between the non-answer rates on trust and approval has never been greater than it is right now. The number of people who simply look the other way when asked whether they trust the Russian president has never been higher — and the chasm between Russians’ hearts and minds is growing ever deeper.
Samuel Greene (@samagreene) is reader in Russian politics and director of the Russia Institute at King’s College London. His book “Putin v. the People: The Perilous Politics of a Divided Russia” (co-written with Graeme B. Robertson) is out next week from Yale University Press.