


Editor’s Note: This post is the second of two parts about a leftward shift in U.S. politics. Part 1 can be found here.
Over the past half-century, Americans’ beliefs and the country’s policies have shifted leftward on an array of cultural issues. The United States has also expanded government social programs, and nearly all such programs are solidly supported by a broad swath of the U.S. population. On top of this, in the past decade, the Democratic Party has been moving left in its policy commitments.
This progressive turn is likely to endure. Once norms and laws favoring tolerance, personal freedom and a big welfare state get institutionalized and don’t have significant adverse side effects, citizens become accustomed to them, making them hard to reverse. Further, getting major policy changes through the U.S. political system is difficult, so once new social programs are enacted, they are hard to dilute or eliminate.
Will policy move further to the left? Despite formidable obstacles, there is good reason to think the answer is yes.
Will the current anti-immigrant backlash halt the leftward shift? California suggests otherwise.
People are less likely to empathize with others they see as different, so a rise in diversity can foster a backlash against policies that promote tolerance or that use tax dollars to extend opportunities and protections to immigrants or members of racial and ethnic minority groups. Does the backlash that contributed to Donald Trump’s election signal a turn to the right in U.S. politics and policy?
The Trump administration keeps making it harder to claim asylum. Here’s how — and why.
One important case, the California experience, suggests that the political impact of racial anxiety and fear may be temporary. It’s easy to forget that until recently, California was evenly split between Republicans and Democrats, much as the country is today.
Beginning in the 1960s, immigrants flocked into the state at a dramatic rate. In 1960, California was home to 9 percent of the U.S. population and 13 percent of its immigrants. By 1990, California had 12 percent of the U.S. population and 32 percent of its immigrants. And after growing rapidly in the first two-thirds of the 20th century, in the 1970s California’s economy began to struggle — first with rising unemployment and inflation, then a decline in manufacturing jobs beginning in the 1980s, then with further damage to the state’s defense-oriented manufacturing sector in the 1990s because the Cold War was ending. These changes created, in sociologist Manuel Pastor’s words, “a perfect stew of racial anxiety and economic drift,” sparking a popular backlash.
In the 1980s, 1990s and early 2000s, Californians elected law-and-order, tough-on-immigration Republicans to the governorship and prominent mayoral positions. And Californians voted in favor of referendums to reduce taxes and limit supports for immigrants and minorities. In 1978, Californians passed Proposition 13, which reduced property tax revenue and limited future property tax increases, putting a crimp in funding for K-12 schools. The proposition also required that any proposed revenue increase must pass both houses of the legislature with a two-thirds majority, rather than a simple majority.
How California’s Prop. 187 is still shaping immigration politics — 25 years after it passed.
As I have noted in my most recent book, California voters banned school busing and reversed other school desegregation mechanisms (1972, later ruled unconstitutional by the state’s Supreme Court); banned affirmative action by the state government and other public entities, including in university admissions (1996); restricted bilingual education in schools (1998); prohibited unauthorized immigrants from using public services (1994, also later ruled unconstitutional); mandated a minimum sentence of 25 years for anyone with a third felony conviction (1994); required juveniles accused of certain crimes to be tried as adults (2000); and imposed term limits on state legislators (1990).
By the mid-2000s, however, California’s economy had revitalized, led by the success of digital tech firms in Palo Alto and San Francisco. And while the state’s population had become even more diverse, as the chart here shows, its white inhabitants had had more time to come to terms with this reality. Since then, California voters have increasingly turned to Democrats. In the mid-1990s, Democrats held 53 percent and 49 percent of the seats in California’s Assembly and Senate, the state’s two legislative bodies; today they hold 75 percent and 74 percent. Democratic gubernatorial candidates won by margins of 13 percent in 2010, 20 percent in 2014 and 24 percent in 2018. These Democratic lawmakers have enacted progressive policies that include paid sick leave, income and health-care assistance for the poor and protections for undocumented immigrants.
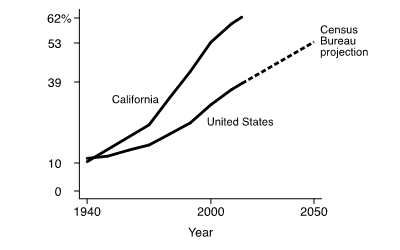
The dashed portion of the line for the United States is a projection. Data source: Census Bureau.
As you can see in the figure above, the nation’s demographic mix is following California’s. Although this doesn’t guarantee that the country will follow California’s political path, the state’s experience can inform our expectations.
What about other obstacles to federal policy change?
Since Newt Gingrich’s turn as party leader in the mid-1990s, the national Republican Party has increasingly pursued an oppositional strategy, refusing to cooperate or compromise with Democrats. As long as Republicans hold the presidency, the House of Representatives or the Senate, the GOP can block much of what Democrats aim to enact. Indeed, with the filibuster, they need only 41 seats in the Senate. And the large number of conservative rural states, each with two Senate seats no matter how small the population, reduces Democrats’ chance at having 60 Senate seats. Even where Republicans can’t block legislation, a conservative Supreme Court may rule it unconstitutional.

Given these obstacles, enacting policies consistent with Americans’ increasingly progressive views may depend on large Democratic electoral victories. That might come if the Republican Party splinters, perhaps between the Trump wing and the old guard. Or a new generation could come to dominate the electorate. Voting patterns tend to be established around age 20 and stick throughout a lifetime. As the figure above shows, Americans who reached age 20 since the mid-1990s have tended to vote for Democrats by large margins. As this group makes up a larger and larger share of voters, it may give Democrats congressional majorities large enough to pass progressive policies like California’s.
Don’t miss anything! Sign up to get TMC’s smart analysis in your inbox, three days a week.
Lane Kenworthy is professor of sociology and Yankelovich chair in social thought at the University of California-San Diego. His most recent book is “Social Democratic Capitalism” (Oxford University Press, 2019).
