


For women and candidates of color running for Congress, 2024 was not a great year. Demographic diversity within the U.S. Congress had been rising for decades, but last fall’s election saw mixed results. The number of women in Congress decreased for the first time since 1979, eventually holding steady with the appointment of Senator Ashley Moody (R-Fla.). The number of Latino members of Congress also decreased for the first time since 1989. While Black and Asian American members of Congress continued to rise, the number of Native Americans in Congress dropped to 4 representatives when Mary Peltola (D-Alaska) lost her reelection race.
The unusual pause in growth for some of these underrepresented groups helps illustrate a tricky puzzle that political scientists have studied for decades.
Why doesn’t Congress look more like the United States?
As of January 2025, most racial and ethnic groups remain underrepresented in Congress. Black Americans make up about 14% of the U.S. population, for instance, but only 12% of the 119th Congress. Women, a slight majority of the American public, account for fewer than than 30% of Congressional seats. Latinos account for 20% of the U.S. population but fewer than 10% of Congressional seats. And Asian Americans (6% of the U.S. population) have a persistent representation gap, with just 4% of Congressional seats. Middle Eastern and North African (MENA) residents represent about 1% of the American public, similar to their representation in Congress (1.3%).
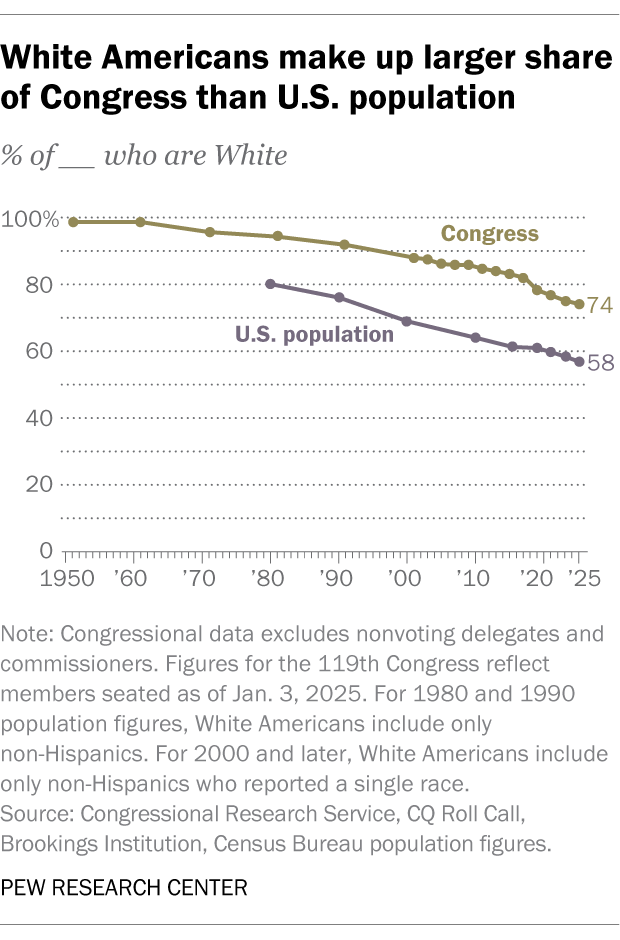
As the Pew Research Center documented after the 2024 election, Congress remains substantially more white and male than the American public (see figure). Congress has diversified in the last 40 years, to be sure, but these shifts have not kept pace with U.S. demographic shifts. Consequently, the racial gap in representation has not changed significantly in recent decades.
Why is this important? Political science research provides ample evidence that addressing this representation gap leads to substantive group policy outcomes as well as greater group civic engagement.
Who do voters want to represent them in Congress?
Prior to the twentieth century, the absence of women and people from racial and ethnic minority groups in U.S. legislatures reflected legal as well as extra-legal prohibitions on voting and running for office. Since the protections of the Voting Rights Act of 1965, political scientists tend to blame voters for the gap in “descriptive representation” – whether the representative belongs to your social or demographic group. Decades of research demonstrates that many voters hold substantial and persistent biases against women and nonwhite candidates. This evidence comes from surveys, experiments, and data about women and minority officeholders.
The results from this research have informed voting rights cases, redistricting battles, candidate recruitment strategies for parties – and countless individual decisions to run or not run for office. This important research is also crucial to understanding which policies are represented in our legislatures, as well as those that are not.
Barack Obama’s 2008 candidacy for the White House provided a high-profile real-world test case of voter racial bias. Hundreds of news articles and research papers explored the role of racism in that presidential election. The general conclusion was that Obama won despite broad and deep-seated racism in the white electorate. Most of the research concluded that if not for the economic collapse of 2008, Obama would have lost, largely because of racism in the electorate.
New research opportunities
But a curious thing happened around this time, effectively opening the door for a different theory of underrepresentation and a slightly different lesson about Obama’s wins in 2008 and 2012. Political scientists began to look more closely at politicians like Obama and Hillary Clinton, whose primary loss against Obama was also highly monitored. Prior to the internet, researchers had to rely on interest group counts of minority and women officeholders – the election winners – to study descriptive representation at a large scale. Because there was little systematic information about the demographics of election losers, scholars ignored them. Researchers had to rely on officeholder data to answer the big descriptive representation questions: Where were minority officeholders winning? In heavily minority voting districts. Where were minority officeholders not winning? In white districts.
Coupling this officeholder evidence with individual-level survey and experimental data, the theory of “voter demand” explained racial underrepresentation in our legislatures. Anyone who has seen the survivorship bias meme knows that relying only on election winners to study the causes of descriptive representation was a mistake, but there was little that researchers could do without more data.
“Get in losers, we’re doing research”
The rise of internet campaigns and social media over the last decade allowed researchers access to something new: demographics and biographies on the candidates who lost. A number of colleagues and I began to collect information about these also-rans, using information from Ballotpedia, and other digital outlets. We also relied on interest groups like Women Donors Network, Facebook candidate profiles, and the Center for American Women and Politics (CAWP) and other academic projects. We focused on women and racial/ethnic minority candidates in state legislatures – and thousands of candidates from diverse backgrounds across nearly all 50 states (in contrast to the dozens of candidates elected to the U.S. Congress). Similar to Congress, state legislatures suffer from systematic underrepresentation of women and racial/ethnic minorities, so we looked here for evidence of the bias against minority candidates. What we and other scholars found was surprising.
Was voter bias the true problem? The first thing we noticed was that very few racial and ethnic minority candidates were on voters’ ballots, particularly in districts with a majority of white voters. There were also relatively few women on the ballot, compared to men. While experiments often ask respondents to choose between candidates of different genders or races, actual voters rarely had this choice. Even in the infrequent elections where we found minority candidates, they often were running against other candidates of the same race or ethnicity, preventing any real-world insights on voter bias. This was frequently the case for women and other groups of interest as well.
What the literature had long described as a “voter demand” problem looked instead like a “candidate supply” issue. In short, most U.S. voters rarely have the opportunity to choose anyone other than white men and (less often) white women on their ballots.
Further, in study after study, researchers found that when women, Black, Latino, and Asian American candidates were on the ballot, they did… just fine. Women candidates generally won as often as men. Latinos were winning at similar rates to white candidates, as were Black candidates. Other studies found Black and Latina women won as often, and sometimes at greater rates, as Black and Latino men.
In recent research, our group ran these data through a tough empirical test, focusing only on races where minority candidates won a competitive primary election and faced a competitive opponent in the general election. We didn’t find a minority candidate penalty. In fact, we found a slight, if noisy, advantage for minority candidates in state legislative races. What makes all of this evidence from real elections and real candidates more puzzling is that studies suggest many voters remain sexist and racially biased. So what is going on?
“Party in the U.S.A.” – yes, parties shape the ballot
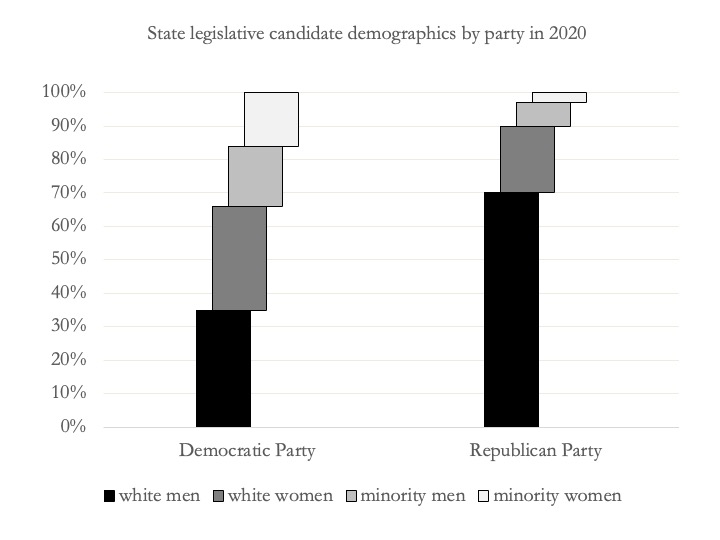
It’s not exactly true that minority and women candidates are rare on ballots. These candidates are rare in one party. As the data from 2020 state legislatures demonstrate, America’s two primary parties look very different from one another in terms of who they put on the ballot. The Democratic Party’s candidates, compared to the Republican Party candidates, look more reflective of the U.S. population overall. For example, white men account for roughly 30% of the U.S. population. And white men made up about 35% of the Democratic Party’s candidate portfolio, compared to 70% of 2020 GOP candidates. Women (50.5% of Americans) make up roughly half of the Democratic Party’s state legislative candidates, but only about 25% of the Republican Party’s 2020 state legislative slate.
At the national level, the same patterns were clear in the 2024 congressional elections. The parties are substantially different in terms of who they are putting up for election. Party leaders typically make these decisions months and sometimes years before voters show up to cast their ballots.
The parties do not just control the candidate selection process. They dictate how voters think about the candidates. How do we know this? One of the things that many researchers do when they test for racial bias is to remove candidate partisanship in their experiments. This is by design, as scholars craft lab and survey experiments to study a treatment in a vacuum, not mimic the complexities of real-world voting in state and federal elections. Political partisanship tends to override or wash out other effects we are trying to study experimentally.
But this is not how most voters understand state and federal candidates. Partisanship dominates modern U.S. election returns. When women, Black, Latino, Asian American candidates run as Republicans in Republican districts, they tend to win. When they run as Democrats in Democratic districts, they tend to win. And when they run in competitive elections, they sometimes win and sometimes lose – and sometimes overperform even in a loss. Election Day voting produces gendered and racial outcomes largely driven by voter partisan choices.
Studying party tides and diversity waves
So why do the parties look like this? Do women and minority candidates have to be better than men and white candidates to overcome voter bias? Are voters and party chairs chasing ghosts when they tell women and minority candidates that they will have a hard time winning if they run for office? Does voter bias only work to penalize minority and women candidates – or can it also work to their advantage?
This last question may help explain why Obama did relatively well with white voters despite the constant racism he faced throughout his 2008 campaign. These are all questions scholars are now investigating at the candidate and party levels, thanks to the explosion of new data and approaches to thinking about the complicated process from ambition to recruitment to campaigning and then winning office. Every step of this pipeline is under systematic scrutiny in ways that were difficult to impossible 20 years ago.
Returning to the 2024 federal results, the role of party decisions illustrates why Congress and our state legislatures continue to look different than the U.S. racial and gender makeup. The photos below of new U.S. senators from each party shows what happens when the parties recruit, support, and vote for different slates of candidates. Aside from Bernie Moreno, a Latino Republican from Ohio, the new Republican senators (on the left) are white and male. In contrast, this year’s new Democratic senators (on the right) are more diverse in terms of gender and both race and ethnicity.

One quick way to see how parties drive descriptive representation is to look at toss-up races, where forecasters like the Cook Political Report thought either Democrats or the GOP could reasonably win a House seat in 2024. The parties ended up splitting these 23 races almost evenly, adding four women and six racial or ethnic minority members of Congress Had Republicans won all 23 toss-up seats, it would have added one more woman to this total. If Democrats had won all the toss-up seats, it would have added five more women and four more Latino, Asian American, and Native American members to Congress.
In the 2024 Congressional races, Republicans had a better year – and one consequence is a less diverse Congress. This will change as Republicans further their efforts to recruit and support women, Black, Latino, and Asian American candidates. But to understand why Congress and our state legislatures do not yet look more like the United States, the answer is largely because of the makeup of the two parties’ slates of candidates. When Democrats do well, as they did in 2018, we will see gains. When Republicans do well, as they did in 2024, we see stagnation or a decline in diversity.
In a polarized era of close elections, we may not see significant changes until both parties do the work to give voters the choices that reflect a continually changing nation. The process of candidate recruitment for the 2026 midterms and the 2028 federal elections is happening right now while few voters are paying attention. The results of these efforts, coupled with the largely partisan choices voters make on Election Day, will determine the diversity of people and voices in America’s national and state legislatures for the next decade and beyond.
Eric Gonzalez Juenke is a 2025-2026 Good Authority fellow.
