I am resurrecting this old post (sorry, no clean 2012 data yet, I’ll update when I have the numbers) because some people were asking about education and voting in a recent comment thread.
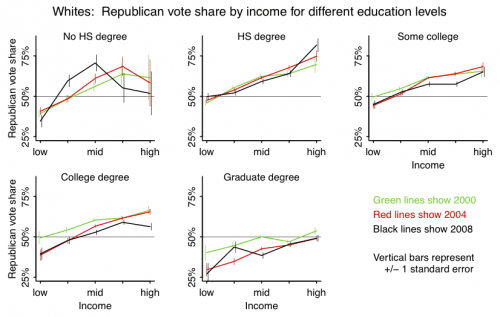
Within any education category, richer people vote more Republican. In contrast, the pattern of education and voting is nonlinear. High school graduates are more Republican than non-HS grads, but after that, the groups with more education tend to vote more Democratic. At the very highest education level tabulated in the survey, voters with post-graduate degrees lean toward the Democrats. Except for the rich post-graduates; they are split 50-50 between the parties.
People were asking about this because they were interested in high-education Asians. I don’t have enough data on Asians to look directly at that question, hence the above graph for whites.
What does this say about America’s elites? If you define elites as high-income non-Hispanic whites, the elites vote strongly Republican. If you define elites as college-educated high-income whites, they vote moderately Republican.
There is no plausible way based on these data in which elites can be considered a Democratic voting bloc. To create a group of strongly Democratic-leaning elite whites using these graphs, you would need to consider only postgraduates (no simple college grads included, even if they have achieved social and financial success), and you have to go down to the below-$75,000 level of family income, which hardly seems like the American elites to me.
The patterns are consistent for all three presidential elections shown above. (The differences in the higher-income low-education category should not be taken seriously, as the estimates are based on small samples, as can be seen from the large standard errors for those subgroups.)
Notes: These graphs show just (non-Hispanic) white voters because (a) most voters are white, (b) minorities tend to vote consistently for Democrats, so there’s less variation in their voting patterns, and (c ) sample sizes are smaller for nonwhite groups so it’s hard to see clear patterns amid the noise. Data come from Annenberg pre-election polls for 2000 and 2004 and Pew pre-election polls for 2008; total number of non-Hispanic white respondents: 26161, 36476, and 15212. Graphs show intended vote in presidential election, including only those who expressed a preference for the Democratic or Republican candidate. Income categories are defined as family income less than $20K, $20-40K, $40-75K, $75-150K, 150K+. This work was done in collaboration with Yair Ghitza.


