


Arthur Brooks of the American Enterprise Institute writes,
The richest data available to social scientists is the University of Chicago’s General Social Survey, a survey of Americans conducted since 1972. This widely used resource is considered the scholarly gold standard for understanding social phenomena. The numbers on happiness from the survey are surprisingly consistent. Every other year for four decades, roughly a third of Americans have said they’re “very happy,” and about half report being “pretty happy.” Only about 10 to 15 percent typically say they’re “not too happy.” Psychologists have used sophisticated techniques to verify these responses, and such survey results have proved accurate.
I agree. The GSS really is great, and I say this both as a user of the survey and from this inside, having recently served a term on the GSS’s external board of overseers. And I applaud Brooks’s column, in which he does an excellent job taking insights from social science research on happiness and connecting them to our everyday lives.
I’d also like to take this opportunity to ask Brooks to issue a correction on an earlier column he published in the New York Times, a bit more than a year ago, when he wrote:
People at the extremes are happier than political moderates. . . . none, it seems, are happier than the Tea Partiers . . .
When this claim came out, it surprised a lot of people, and one of them, Jay Livingston, a sociologist at Montclair State University in New Jersey, went to the trouble of checking the data at . . . the General Social Survey, the scholarly gold standard for understanding social phenomena. Here’s what he found:
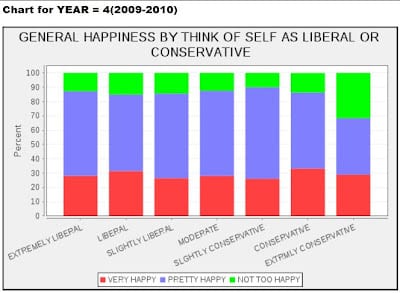
The GSS does not offer “bitter” or “Tea Party” as choices, but extreme conservatives are nearly three times as likely as others to be “not too happy.”
Livingston reports that the sample size for “Extremely Conservative” here is 80. Thus the standard error for that green bar on the right is approx sqrt(0.3*0.7/80)=0.05.
So how could Brooks have made such a mistake? I have two theories:
1. Brooks has some other data source that directly addresses the happiness of supporters of the Tea Party movement.
2. Brooks looked at the cumulative GSS file from 1972, averaging over the last 40 years, and attributed this aggregate pattern to the Tea Party, which has only existed since 2009. I’d hate to think Brooks did this, but he did mention the GSS in his op-ed, and Livingston does provide this helpful graph:

If you look at the cumulative file, you can indeed see some of the patterns Brooks discusses in his article. But the data during the Tea Party period look much different.
I wouldn’t be too hard on Brooks, though. He seems to have made a mistake, but I’ve made this sort of mistake myself. It can be tricky working with survey data, especially in a high-visibility, low-rigor place such as the NYT op-ed page. In contrast, when we publish in scholarly journals, we have many chances for revision and peer review (more chances to catch the mistakes), and not too many people read what we write in any case!
As I wrote awhile ago, New York Times columnists do not seem to be in the habit of correcting statistical errors. It’s not too late, Arthur Brooks! In many ways, it makes the GSS story even better to recognize that, great data source that it is, it can still be tricky to get things right.
